
iGlobe: Interactive Visualization and Analysis of Geospatial Data Sets on a 3D Globe
iGlobe is a unified framework that allows integration of disparate geospatial data sources that include remotely sensed observation data, climate model outputs, population and critical infrastructure data, and provide an interface for both client visual analytics and the sever-side data mining capabilities. We see several benefits of such unified framework for both scientists and policy makers. First, it hides complex transformations that are required to overlay climate variables on geospatial data layers like land use and land cover. Second, it allows visual analytics capabilities where users can directly observe and correlate disparate events, for example, proximity of temperature extremes to the population and precipitation extremes over croplands. Thus the tool is invaluable to scientists, policy makers and general public alike.
|
|
|
|
|
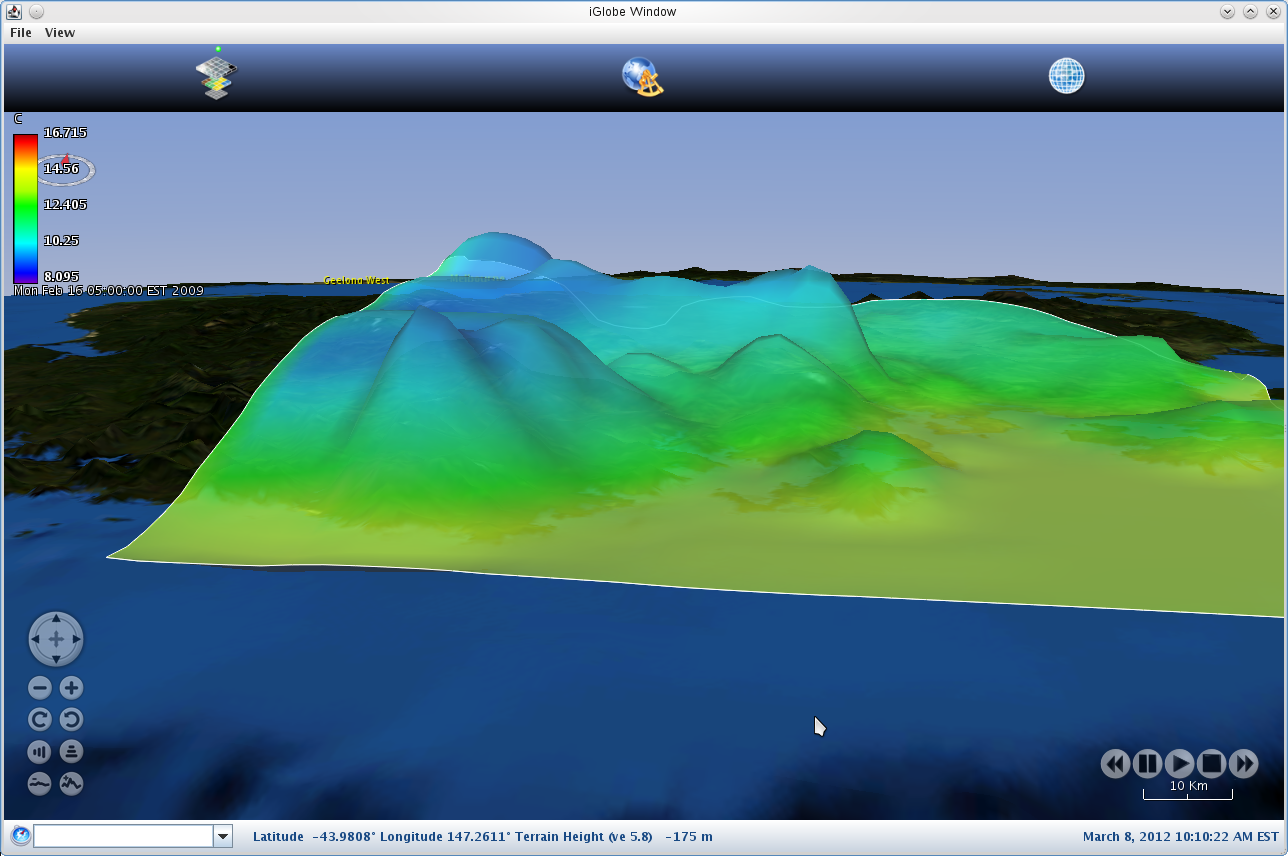
Try a demo of iGlobe here. Requires java. Run java -jar Iglobe.jar from the command prompt.
The iGlobe source code is open source under the NASA public license and available for checkout at https://worldwind23.arc.nasa.gov/iglobe/. Discussions and questions about iGlobe can be found at the following bulletin board. Click here for a short video demonstration of iGlobe. The narrative for the video is available here.