
Declarative Debugging in JIVE
February 19, 2008 - 03:30:00 UTC by Jeffrey K. Czyz
JIVE's ability to visualize program executions and revisit past states is indeed very useful. However, in conjunction with the ability to also search through a program's execution history, JIVE becomes a powerful tool for declarative and visual debugging. In this tutorial, we will explore JIVE's declarative (or query-based) debugging facility and see how it ties together with visualization and reverse stepping.
Declarative vs Procedural Debugging
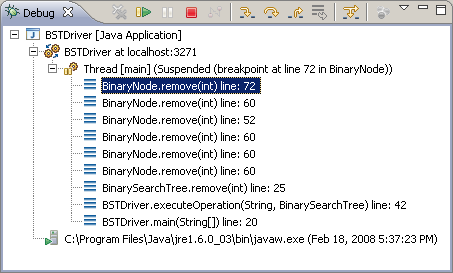
The procedural approach has typically been used when debugging programs. Here, a programmer would proceed step-by-step and object-by-object in order to uncover the cause of an error. This process is tedious and error-prone as the programmer must mentally construct the program's execution state by examining variables on the call stack and objects on the heap. Furthermore, the presence of a bug is discovered only after the statement that caused the bug was executed. While traditional debuggers only provide access to the stack trace, sometimes the cause of a bug lies in a portion of the execution history that is not in the stack trace. Thus, access to the full execution history (rather than just the stack trace) is necessary.
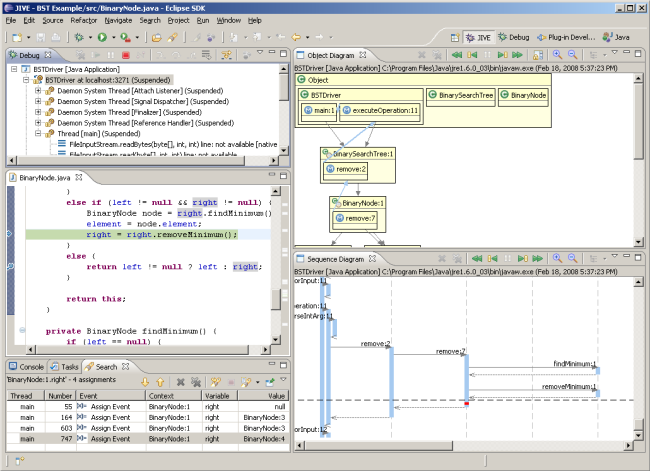
In contrast, in the declarative approach to debugging, the program's execution history can be searched using an extensible set of queries. Queries are formulated using the source code or the diagrams, and the results are reported visually as diagram annotations and also summarized in a tabular or tree format. Each match in the search result corresponds to an event that occurred during the program's execution. An event can be visualized as a point on the sequence diagram from which a corresponding program state (i.e., object diagram) can be easily revisited by JIVE. The programmer may then step through the execution history in either direction in order to uncover the cause of the error.
Formulating and Running Queries
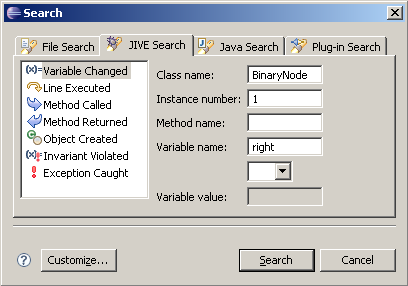
To initiate declarative debugging, first you should start debugging your program using JIVE. At any time during execution—or even after the program has terminated—open Eclipse's Search dialog by selecting Search → Search... or by using Ctrl+H. Select the JIVE Search tab if it is not the current one. A list of available queries is located on thevleft side of the dialog. Select a query and then enter the appropriate arguments in the input fields. Each query's input fields will be covered at the end of the tutorial. The search facility may attempt to auto-fill these fields based on the current source code or diagram selection. Once the necessary fields are filled, select the Search button.
Exploring the Search Results
The outcome of a query is often a set of results rather than a single result. Each result corresponds to an event that occurred during the program's execution. The result set will appear in Eclipse's Search view and also as annotations on the sequence diagram. The Search view can display the results in two formats: as a tree or a table. The tree format is useful for seeing what the call path was when the event occurred. The table format is better suited for quickly scanning the results. Use the drop-down menu to toggle between either format.
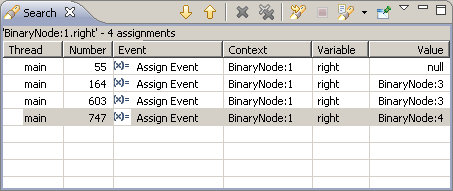
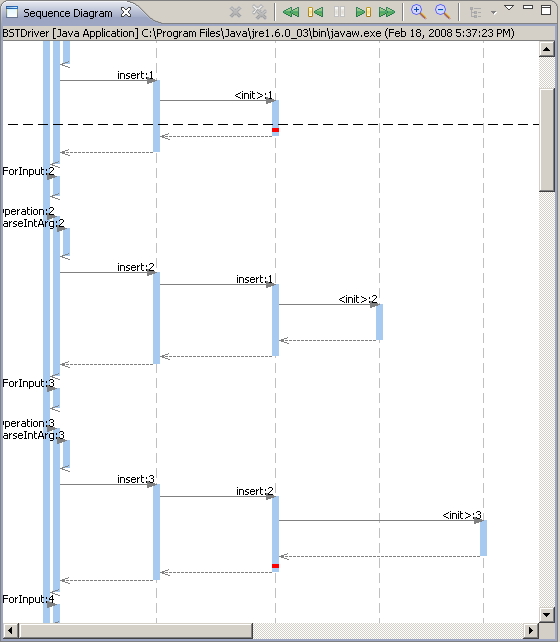
The Search view can be used to easily navigate through the sequence diagram from one result to the next. Simply double click a result, and the sequence diagram will scroll to the event location. The event will be annotated by a red band on the method activation in which it occurred. The up and down arrow buttons on the Search view can also be used to explore the results. Additionally, navigating to an event will result in revisiting the program state at the time of the event, i.e., the object diagram existing at that state will be recreated. You may then step forward or backward through the execution history.
Available Search Queries
While JIVE's declarative debugging facility is extensible in nature, we provide a set of built-in queries that are frequently used. Below is brief explanation of each search query.
Variable Changed
This query allows you to search for all changes to a variable during execution, as well as all changes that meet a certain condition.
- Class name—the name of the class containing the variable
- Instance number (optional)—a particular instance of the above class
- Method name (optional)—the name of the method containing the variable (for local variables)
- Variable name—the name of the variable that was changed
- Operator (optional)—a relational operator to apply with the variable on the left side and a value on the right side; if the condition is met, then the match will be included in the results
- Value (optional)—a value for the right side of the relational operator
Line Executed
This query allows you to search for all executions of a line from a given source file.
- Source path—the path of the source file containing the line
- Line number—the line that was executed
Method Called
This query allows you to search for all calls of a method occurring during execution.
- Class name—the name of the class containing the method
- Instance number (optional)—a particular instance of the above class
- Method name—the name of the method that was called
Method Returned
This query allows you to search for all returns of a method occurring during execution, as well as all return values that meet a certain condition.
- Class name—the name of the class containing the method
- Instance number (optional)—a particular instance of the above class
- Method name—the name of the method that returned
- Operator (optional)—a relational operator to apply with the return value on the left side and a value on the right side; if the condition is met, then the match will be included in the results
- Value (optional)—a value for the right side of the relational operator
Object Created
This query allows you to search for all objects created during execution.
- Class name—the name of the class that was instantiated
- Instance number (optional)—a particular instance of the above class
Invariant Violated
This query allows you to search for all violations of a simply class invariant during execution.
- Class name—the name of the class containing the invariant
- Instance number (optional)—a particular instance of the above class
- Variable name—the name of the variable for the left side of the invariant
- Operator—a relational operator to apply with the variable on the left side and a value on the right side; if the condition fails, then the match will be included in the results
- Variable name—the name of the variable for the right side of the invariant
Exception Caught
This query allows you to search for all exceptions caught (and from where they were thrown) during execution.
- Class name (optional)—the name of the class catching the exception
- Instance number (optional)—a particular instance of the above class
- Method name (optional)—the name of the method that caught the exception
- Exception name (optional)—the name of the exception that was caught
Conclusion
This tutorial described JIVE's declarative approach to debugging object-oriented software and showed how it compliments the traditional procedural approach. The Search dialog and view were utilized to formulate queries and display their results. It was also shown how JIVE's visualization and reverse stepping facilities are used in tandem with searching a program's execution history to create a novel approach to debugging. Lastly, the queries available standard with JIVE were described.