Managing Large Executions in JIVE
This tutorial explains how to manage large executions in JIVE. There are three approaches: (1) Use of Exclusion Filters, (2) Debugging over an Interval, and (3) Dyanamic Slicing. We explain each of these techniques below.
Use of Exclusion Filters
The application of Exclusion Filters helps reduce the number of objects and method activations that need to be visualized. This in turn reduces the size of object and sequence diagrams. To access the Exclusion Filter, from the Package Explorer tab, select the menu item Run → Debug Configurations. This will bring up the following window:
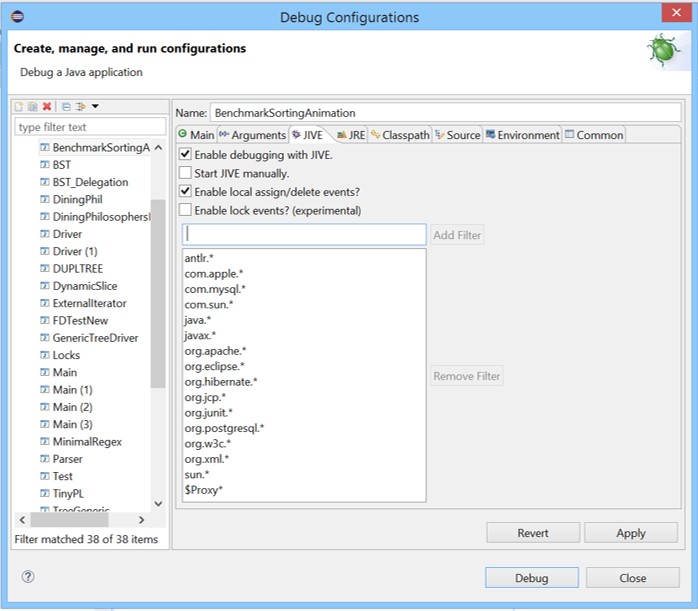
Select the JIVE tab in order to see the list of packages and libraries that JIVE has already excluded from being visualized during execution. A good package to add to the exclusion list is
jdk.*
To do so, enter jdk.* in the text box and click on Add Filter. In this manner, you may add (one by one) the names of classes and packages for exclusion, and in this way reduce the size of visualizations. To undo the exclusion, select the appropriate class or package from the list and click on the Remove Filter button.
Debugging over an Interval
This technique is useful for focusing the debugging on a specific package or subsystem without visualizing the entire program execution.
Start eclipse from the command line, as follows:
eclipse -console
This will bring up the 'osgi' console.
Using the JIVE graphical user interface, set three breakpoints
in the program:
i. at the start of the program (B1);
ii. at the beginning of the debug interval (B2); and,
iii. at the end of the debug interval (B3).
Run the program from the JIVE graphical user interface until breakpoint B1. From the osgi console, execute:
jive status
This will show the task id number (TID) with a star against it. Say the number is n. Then execute:
jive stop n
JIVE will stop collecting debug events. From the JIVE graphical user interface, resume debugging the program. It will run to breakpoint B2 and pause. But no diagrams will be seen from B1 to B2.
From the osgi console, execute:
jive start n
JIVE will now start collecting debug events and draw diagrams. From the JIVE graphical user interface, resume debugging the program. Now the object and sequence diagrams will appear until breakpoint B3 is reached. From the osgi console, execute:
jive stop n
From the JIVE graphical user interface, resume debugging the program. It will run to completion without any further event collection or generation of diagrams.
You can set any number of debug intervals and debug over these intervals, as explained above.
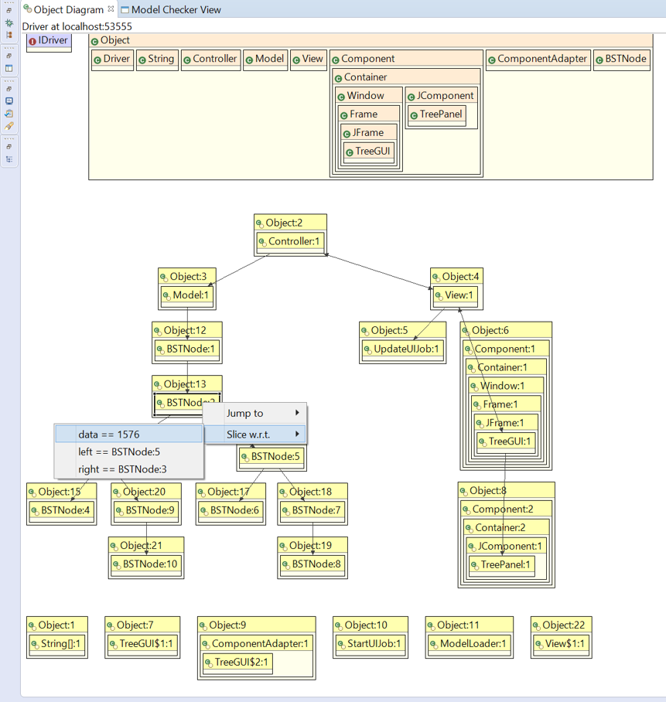
Dynamic Slicing
This is a technique for reducing the size of the object and sequence diagram by focusing on a particular object field of interest. This is done through object diagram by right-clicking on an object and selecting the "Slice w.r.t." command. Illustrated below is the the object diagram for a simple model-view-controller application. The object BSTNode:13 has been right-clicked and the slicing operation is being initiated with respect to the field 'data'.