Knowledge Transfer via Multiple Model Local Structure Mapping
In many applications, it is expensive or impossible to collect enough labeled data for accurate classification in the domain of interest (target domain), however, there are abundant labeled data in some relevant domains (source domains). For example, when training a spam filter for a particular user, if we don't have any labeled data from the user for training, we can only rely on spam and ham emails from multiple public resources. We notice that there are usually several relevant source domains, and different classifiers trained from these domains contain different knowledge about the target domain and thus have different advantages, due to the the distributional differences among the source domains. Therefore, different models may be effective at different regions or structures in the new and different target domain, and no single model can perform well in all regions. The challenge is how to dynamically select the model that best represents the true target distribution underlying each example in the target domain.
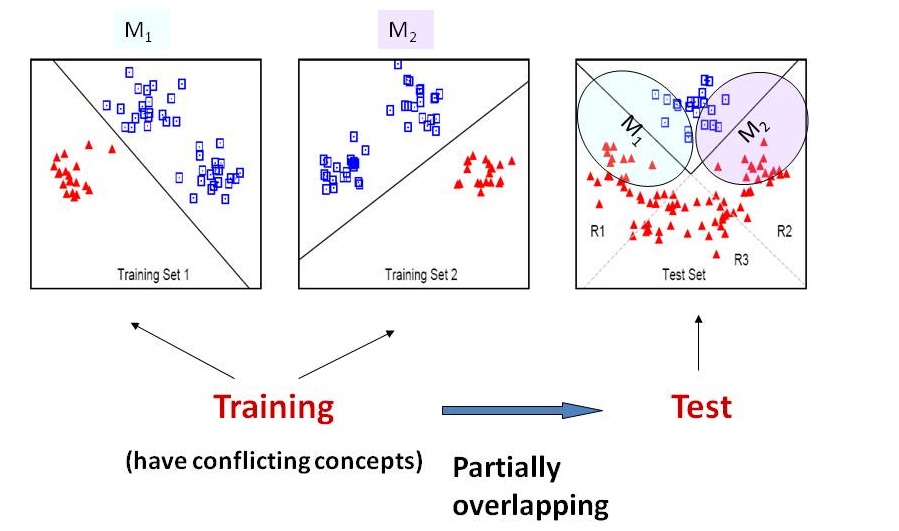
A toy learning problem with two source domains and a target domain is shown in the following plot. The two source domains have partially conflicting concepts and their decision boundaries are the straight lines. For the target domain, however, the optimal decision boundary is the V-shape solid line. As can be seen, the regions R1 and R2 are "uncertain" because the two source domains are conflicting there. If we either simply collapse the two data sets and try to train a classifier on the merged examples, or combine the two linear classifiers M1 and M2 trained from domain 1 and domain 2 respectively, then those negative objects in R1 and R2 will be hard to predict. Those semi-supervised learning algorithms do not work either because they only propagate the labels of the training examples to the unlabeled examples. In this case, there are conflicting labels in R1 and R2, causing ambiguous and incorrect information to be propagated. But it is obvious that, if M1 is used for predicting objects in R1 and M2 used for objects in R2, then we can label all test examples correctly. Therefore, ideally, one wish to have a "locally weighted" ensemble framework that combines the two models, and weighs M1 higher at R1 and M2 higher at R2.
We propose to combine the output of multiple classifiers trained from multiple source domains through a locally weighted ensemble framework. Different from traditional ensemble approaches, this locally weighted model averaging method weighs individual models according to their local behaviors at each test object. One challenge is that the optimal per-object weight vectors cannot be computed exactly in reality, since the true class label for each test object is not known a priori. However, we know that a model should have a higher weight if its prediction on the object x is close to the true conditional probability of class label y: P(y|x). Therefore, the main task is to formulate similarity between the model predictions and the unknown true P(y|x).
To achieve this goal, we can model the underlying P(x) from the unlabeled test set in order to infer P(y|x). Specifically, we make a "clustering-manifold" assumption, as commonly held in semi- supervised learning, that P(y|x) is not expected to change much when the marginal density P(x)is high. In other words, the decision boundary should lie in areas where P(x) is low. Under such an assumption, we can compare the difference in P(y|x) between the training and the test data locally with only unlabeled test data. We propose to cluster the data in the target domain and assume that the boundaries between the clusters represent the low density areas. As a result, if the local cluster boundaries agree with the classification boundary of a model around object x, then we assume that P(y|x,M) is similar to the true P(y|x) around x, and thus the weight for model M ought to be high at x.