I now give a brief overview of some of my past and current research projects.
There is increasing evidence that 3D visualizations give better results than 2D visualizations [8, 61, 66, 72]. I am interested in investigating approaches for constructing effective 3D visualizations. Specific topics of interest include interactive selection and manipulation of objects, context display of selected objects [11, 28], occlusion-reduction [11], and experimental studies on 3D visualizations [66, 72].
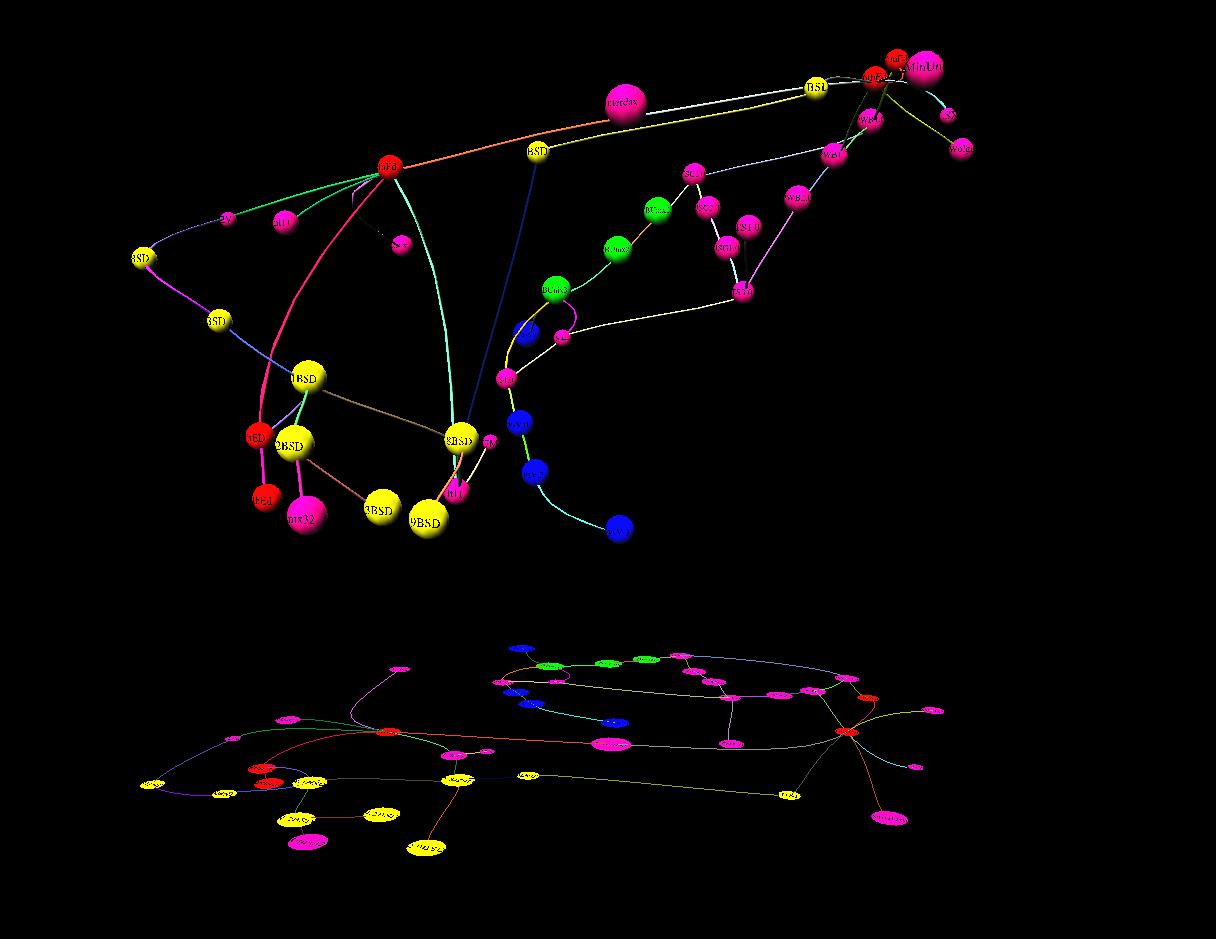
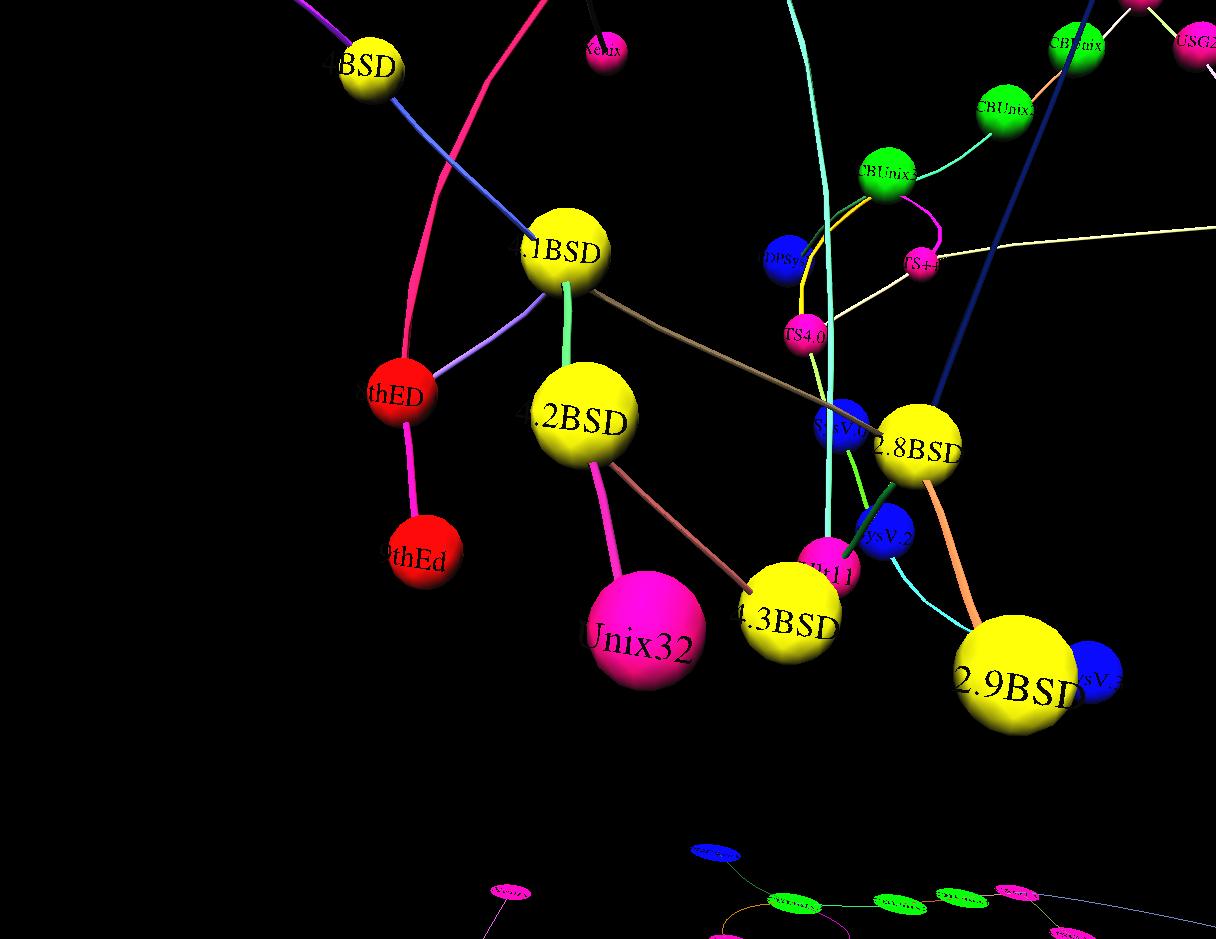
Several techniques have been proposed in the past for constructing 3D visualizations of directed acyclic graphs [27, 40, 60, 62, 73]. However, most of them use elementary layout algorithms resulting in drawings with unnecessarily large volume, sharp angles between edges, excessive bunching of some vertices, and occlusion problems. I have developed a system, called GIOTTO3D [34], that constructs effective 3D visualizations of directed acyclic graphs. To improve the quality of its visualizations, GIOTTO3D employs a novel combination of a powerful 2D layout technique and a lifting transformation that uses the third dimension to visualize hierarchical relations among the vertices. It represents vertices as spheres with user-specified sizes and edges as Bezier tubes [67]. Fig. 1 shows a 3D visualization constructed by GIOTTO3D.
Figure: A 3D Visualization constructed by GIOTTO3D showing the
evolution history of
Unix:
color plate (a);
color plate (b).
GIOTTO3D provides the usual 3D navigational operations: rotation, translation, and zooming. Fog and appropriate lighting can be used to enhance depth perception. A user can also select a subgraph and perform various operations on it, including hiding (un-hiding) it, or hiding (un-hiding) all the descendants of its vertices. Users can also choose to either show an outline of the hidden objects (to maintain context for non-hidden objects) or not show them at all (to filter information).
Future work on GIOTTO3D includes improving its visualizations and navigational and selectional supports, using it for applications such as Web-navigation, and conducting usability studies assessing the effectiveness of its visualizations in understanding the structure of information in an application.
The conception of the WWW opens up an exciting new channel for interaction between people, and new potentialities are being discovered every day. I have developed a Web-based service using which a user can draw graphs and translate graph-descriptions from one format to another by employing a variety of graph drawing algorithms and translators [7]. The home page of the service is at http://loki.cs.brown.edu:8081/graphserver/home.html. This service acts as central facility where a user can ``shop around'' and choose the algorithm/translator suitable for her application and can be useful for a variety of tasks such as drawing a graph from a particular application, conducting experimental studies on algorithms, and demonstrating and comparing algorithms for research or educational purposes. It also provides a medium for reducing the time-lag between latest innovations in graph visualization and their availability for public use.
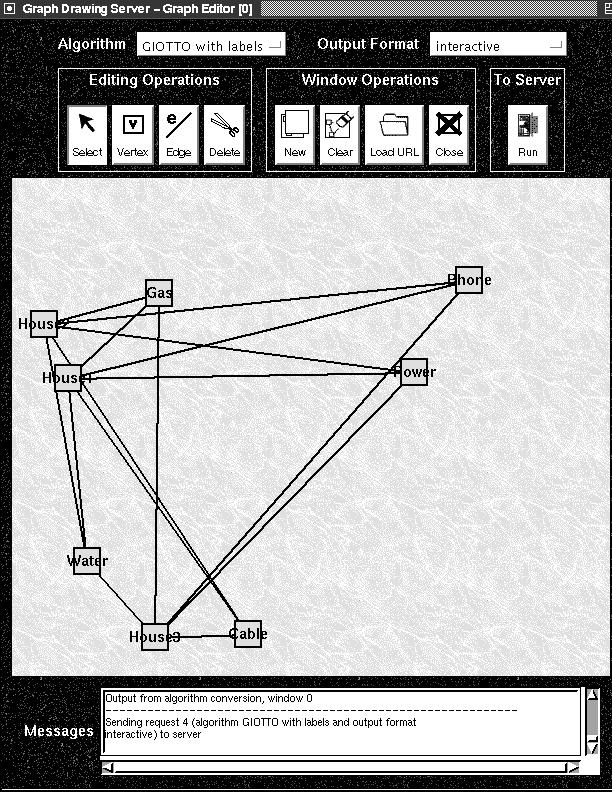
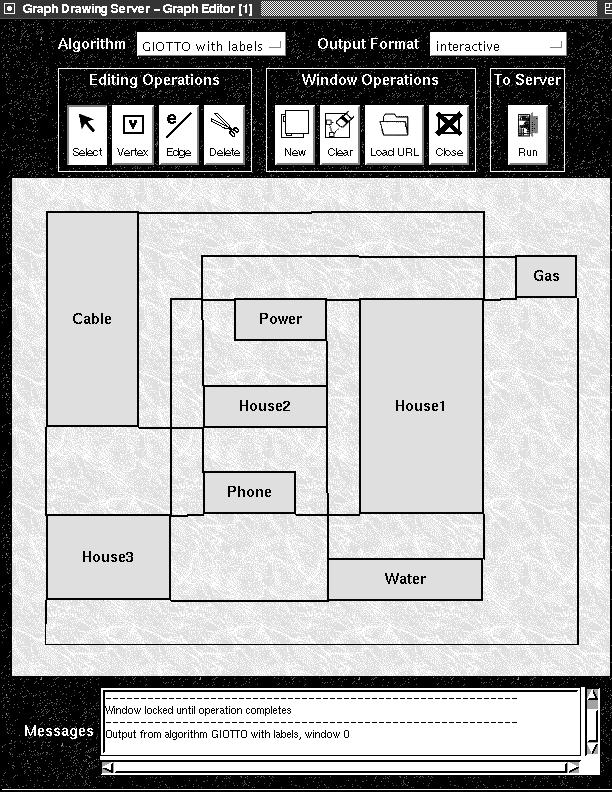
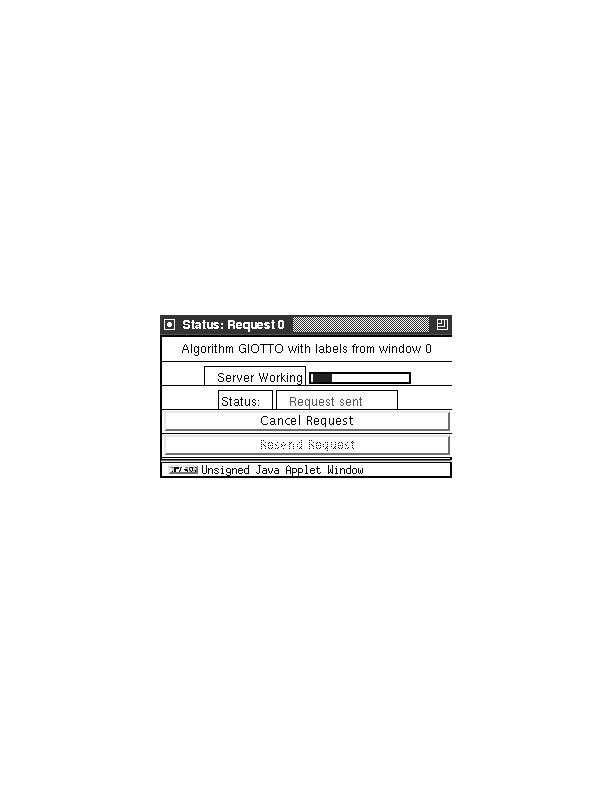
In a typical user-scenario, the user submits a graph, gives a choice of the type of service desired (drawing a graph or performing a translation), the drawing algorithm to use (if it is a drawing request), and the format in which she wants the output to be in. Example output formats include postscript, MIF, GIF, Xfig, and various textual formats. The service has two kinds of user-interfaces: an HTML-form based interface from which the user can submit her request by filling an HTML-form, and an applet-based graph editor. The graph editor enables the user to interactively create and edit a graph, and supports several basic graph editing features such as inserting, deleting, and moving vertices, edges, and edge-bends. Fig. 2 shows an example of constructing a drawing using the graph editor. While handling a user-request, the service displays a status window (See Fig. 2(c)) from which the user can determine the status of the request and cancel it if they wish so.
We are pleased with the interest generated by the service. At the time of writing of this report (Mid December), it has already completed more than 4000 draw/translate requests since June (when it first became operational) and more than 2500 requests since September (when it was first publically announced -- in the Graph Drawing '96 Symposium) from Web users from various kinds of host domains. Several researchers have also expressed interest in placing their algorithms on this service.
Future work on the service includes adding new algorithms and translators and designing a framework that would allow users to add the algorithms by themselves, improving our graph editor, and incorporating facilities for generating statistics on (the performances of) algorithms.
Figure: Drawing a graph using the applet based graph editor of the
Web-based graph drawing and translation service of [7]; the drawing algorithm chosen by
the user is GIOTTO-with-labels.
(a) The interface of the editor and the input graph;
(b) drawing returned by the server;
(c) status window displayed while the request is being handled by the service.
Trees are very popular data structures because they can be used to model hierarchical relationships among objects. Their visualization is widely studied and various techniques have been proposed [12, 10, 25, 45, 49, 62, 59]. In a theoretical work on constructing area-efficient node-link hierarchical (children of a node placed either below or at the same level as its parent) 2D drawings of trees [30, 31], I have shown that every tree can be drawn in this manner in linear area, i.e., in area proportional to the number of vertices.
A planar drawing is a 2D drawing with no edge-crossings. An upward drawing is a 2D drawing in which for every directed edge u->v, vertex v is always drawn at a higher y-coordinate than u. A rectiliear drawing (also known as bend-free orthogonal drawing) is a 2D drawing in which each edge is drawn as a horizontal or vertical straight-line segment. Upward drawings are desirable because they capture the hierarchical relationships very well and are easier to navigate through. Rectilinear drawings are generally more ``good-looking'' because they are bend-free and the edges are restricted to orthogonal directions only.
The upward planarity testing problem is defined as follows: ``Given a directed acyclic graph, determine whether it admits an upward planar drawing''. Similarly, the rectilinear planarity testing problem is defined as ``Given a graph, determine whether it admits a rectilinear planar drawing''. These problems are considered fundamental problems in the area of graph drawing. The upward planarity testing problem is considered a fundamental problem in order theory also.
Because of the importance of these problems, several researchers have worked on devising techniques for solving them efficiently. Although efficient solutions for specific categories of graphs [21] and directed acyclic graphs [3, 4, 22, 39, 71] have been found, the problems for general graphs and directed acyclic graphs had eluded an efficient solution. In a theoretical work presented in [32, 33], I have shown that both these problems are NP-hard, and hence, unlikely to have efficient solutions.
Application-specific restrictions on placement of vertices and edges can enhance a drawing's ability to present information to the user. For example, a study of layouts of social networks shows how placement of a vertex can affect its perception as a prominent vertex or as an important bridge. A common way of incorporating application-specific restrictions in a drawing is by defining (mathematical) constraints on graph-objects whose satisfaction gives a drawing adhering to the desired restrictions [16, 43, 46]. Most of the current graph layout techniques based on this approach, however, suffer from two problems, namely, they do not provide adequate facilities to users for specifying constraints and they generally run slowly.
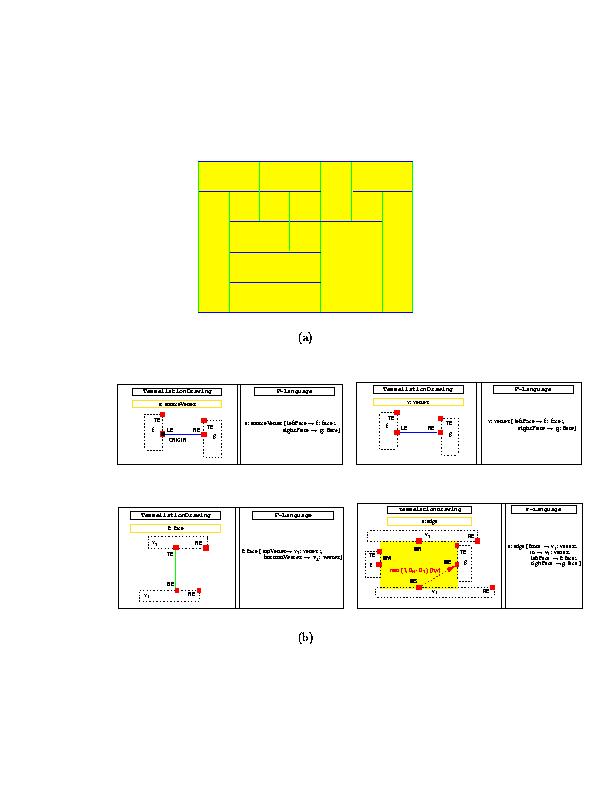
Visual languages have been found to simplify the task of programming. DOODLE [13, 14] is a rule-based visual language for querying object-oriented databases. In [15], I have shown how users can specify constraints visually and construct a graph layout satisfying those constraints by writing simple visual programs using DOODLE. I have also characterized a category of such visual programs that can be executed in linear time. Fig. 3 shows such a visual program for constructing tessellation drawings of graphs. This figure also demonstrates the power of visual programming; just 4 rules are enough for writing a program that is otherwise very complex if written in a conventional (textual) language. Our hope is that a taxonomy of visual programs for constructing visualizations (not just graph visualizations), classified by their expressive-powers and running speeds, would allow us to a develop a framework for efficient execution of such programs.
Figure 3: Visual programming for constructing visualizations that
satisfy user-defined constraints:
(a) a tessellation drawing; (b) a
visual program written using DOODLE that constructs the drawing of
part (a). This program executes in linear time.
Several techniques have been developed for drawing graphs. Some of them have also been analyzed theoretically for their worst case behaviors. However, there are very few experimental studies [6, 37, 41, 42, 56] that evaluate their performances on ``real-life'' graphs. Unfortunately, some of these studies use small suits of test-graphs, and some only give subjective evaluations.
In [20, 19], I have compared the performances of four well-known techniques for drawing general graphs, namely, GIOTTO [69], Pair [57], Bend-Stretch [70], and Column [5] on a test-suite consisting of more than 11,000 graphs. We tested these techniques on both their running speeds and on the quality of drawings constructed by them.
In [18], I have conducted a similar study of four well-known techniques for constructing upward drawings of directed acyclic graphs, namely, Dot [47], Layers [68], Lattice [24], and Visibility [23] using two test-suites of graphs, namely, North's graphs [55] and Pert graphs, consisting of more than 1200 and 800 graphs each.
Our studies not only provide a much needed experimental evaluation with large test-data but also define a methodology for conducting similar studies on other graph drawing techniques. In addition, our study of [18] inspired us to design a new algorithm that combines the strengths of the techniques tested. Our new algorithm seems to work well in practice [18]. We believe that such an engineering of algorithms based on experimental evaluation and combination of known techniques will eventually lead us to efficient algorithms for drawing graphs.