About JIVE
JIVE is an interactive execution environment for Eclipse that provides visualizations of Java program execution at different levels of granularity.
Both beginner and advanced Java programmers will benefit from JIVE's rich visualizations of object structures and method interaction, as well as the ability to step forwards and backwards in execution.
JIVE provides a search engine over the runtime structures and helps pinpoint errors that occur at any point in the execution history without having to manually step through the code.
JIVE helps software maintainers by providing insight into the working of correct Java programs. It supports visualization over intervals, so that a software maintainer can focus on just the parts of the code that are being modified.
JIVE supports large executions through its exclusion filters, visualization over intervals, and dynamic slicing.
JIVE can be used with the standard JDK or Android SDK.
Interactive Visualizations
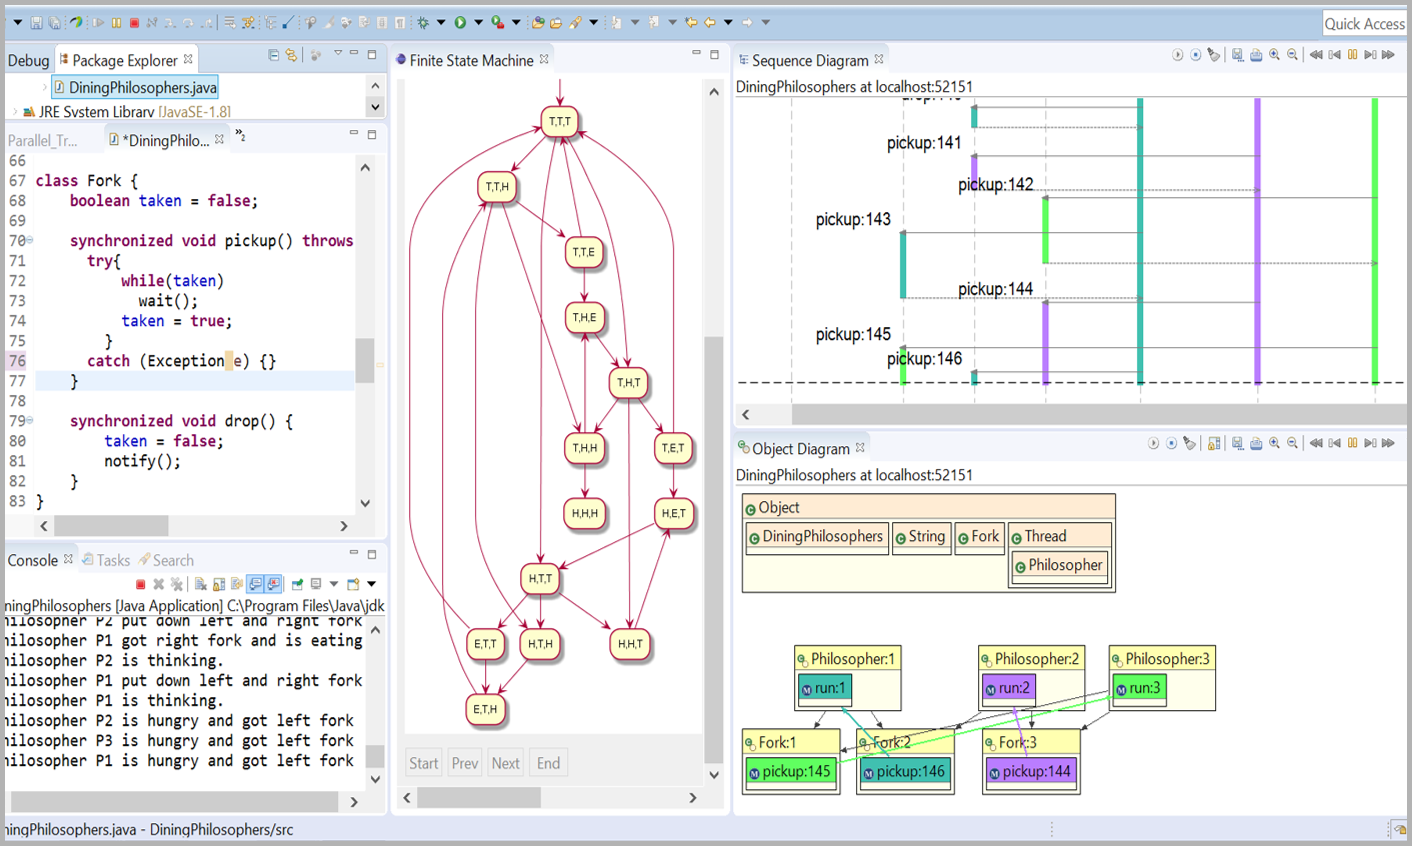
JIVE depicts both the runtime state and call history of a program in a visual manner. The runtime state is visualized as an enhanced object diagram, showing object structure as well as method activations in their proper object contexts. The call history is depicted as an extended sequence diagram, with each execution thread shown in a different color, clarifying the object interactions that occur at runtime. The diagrams are scalable and can be filtered to show only information pertinent to the task at hand. A JIVE plugin extension supports compact sequence diagrams for an abstracted view of the execution history.
Query-based Debugging
 Traditional debugging is a procedural process in that a
programmer must proceed
step-by-step and object-by-object to find the casue of an error. In
contrast, JIVE supports a declarative approach to debugging by
providing an extensible set of queries over a entire
program's execution history, not just over the stack of outstanding calls.
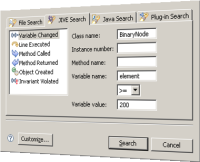
Queries are formulated using the source code or the diagrams, and the results
are shown in a tabular format and also as diagram annotations. JIVE also
supports dynamic slicing in order to achieve reduced visualizations
and focus on the root-cause of errors.
Traditional debugging is a procedural process in that a
programmer must proceed
step-by-step and object-by-object to find the casue of an error. In
contrast, JIVE supports a declarative approach to debugging by
providing an extensible set of queries over a entire
program's execution history, not just over the stack of outstanding calls.
Queries are formulated using the source code or the diagrams, and the results
are shown in a tabular format and also as diagram annotations. JIVE also
supports dynamic slicing in order to achieve reduced visualizations
and focus on the root-cause of errors.
Reverse Stepping
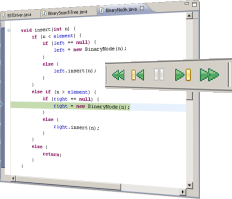
JIVE supports both forward and reverse stepping of Java programs. Often, a programmer may discover that an error has occurred only after the errant statement has been executed. Providing the ability to step backwards saves a programmer the time and effort of re-executing the program until the point of error. JIVE also provides the ability to jump directly back to any previous point in the execution history in order to observe the object diagram at that point. Reverse stepping and jumping work closely with query-based debugging to narrow down the cause of program errors.
State Diagrams and Property Checking
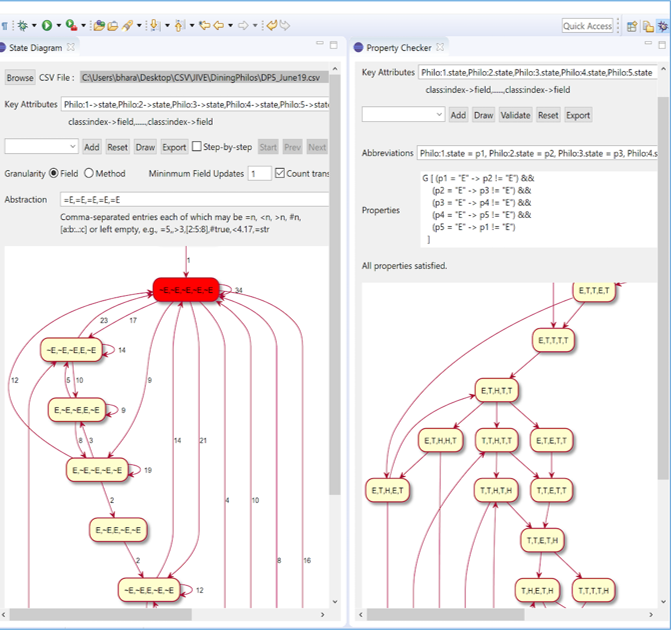
The state diagram plugin extension allows the user to extract a finite-state model from the execution trace of a program run under JIVE and check properties about this model. There are two views supported by this extension: a state diagram view, and a property checker view. In the state diagram view, the user inputs an JIVE execution trace and chooses fields of the Java program that should constitute the state vector. The displayed state diagram shows the progression of state changes for these fields. The state diagram can be viewed in a reduced form by specifying model abstraction criteria through a simple textbox. In the Property Checker view, properties about the model can be specified through a textbox. Global properties to be satisfied by all states, existence of states satisfying certain properties, as well as paths between states can be specified using a simple property specification language.